Outcomes
Modules 1,2,4,5 and 9
We are only providing in here sample outputs for Module 1 but they all share the same structure. For full outputs reference, please see sample outputs:
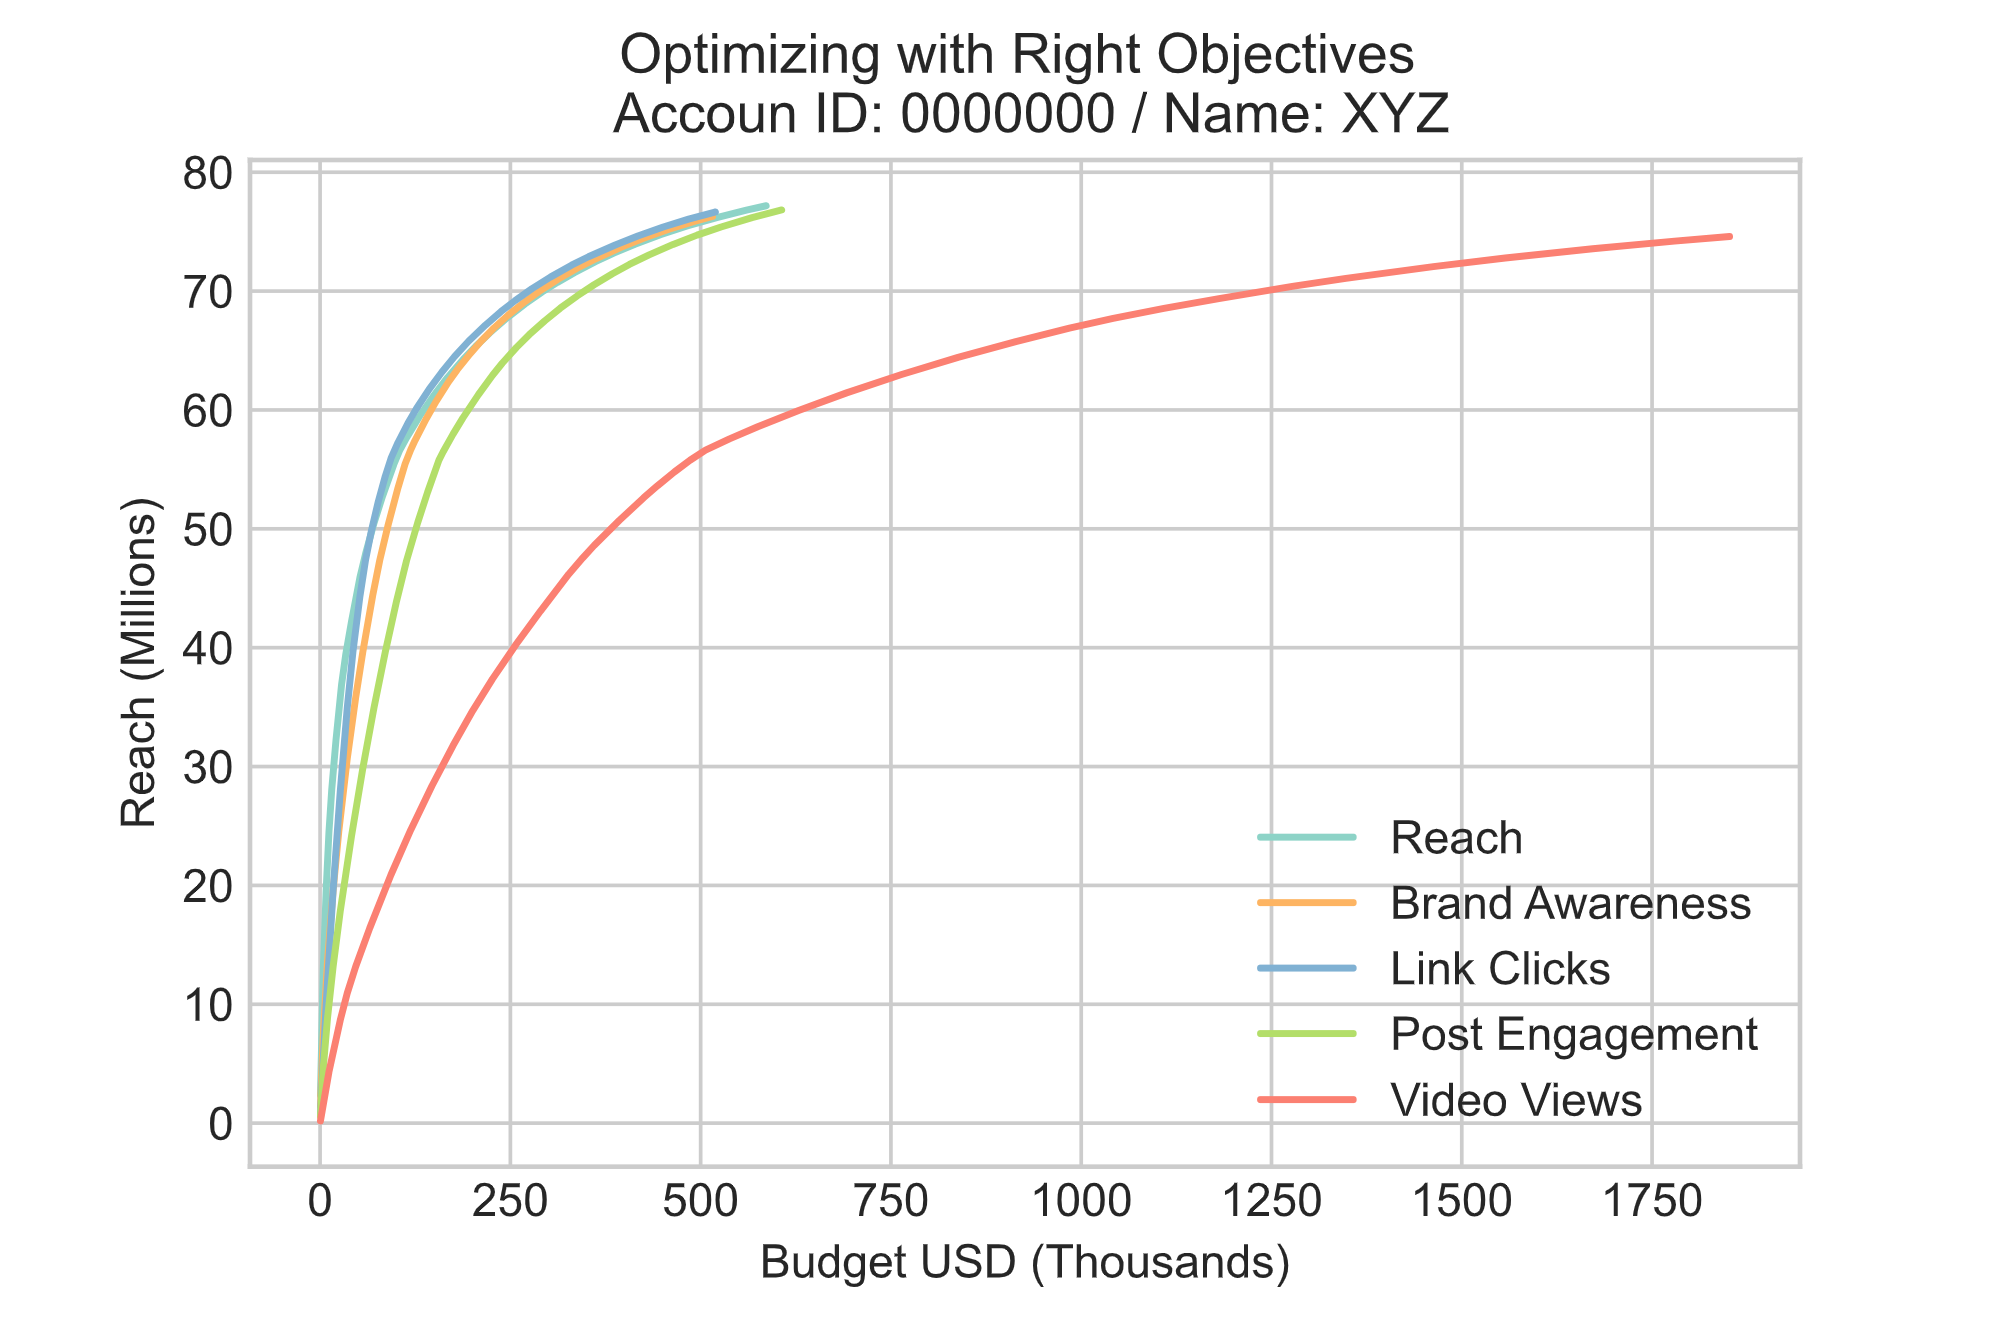
1. 01_Reach.pdf: Plot portraying a curve of Budget (x-axis) vs predicted reach (millions of users, y-axis)
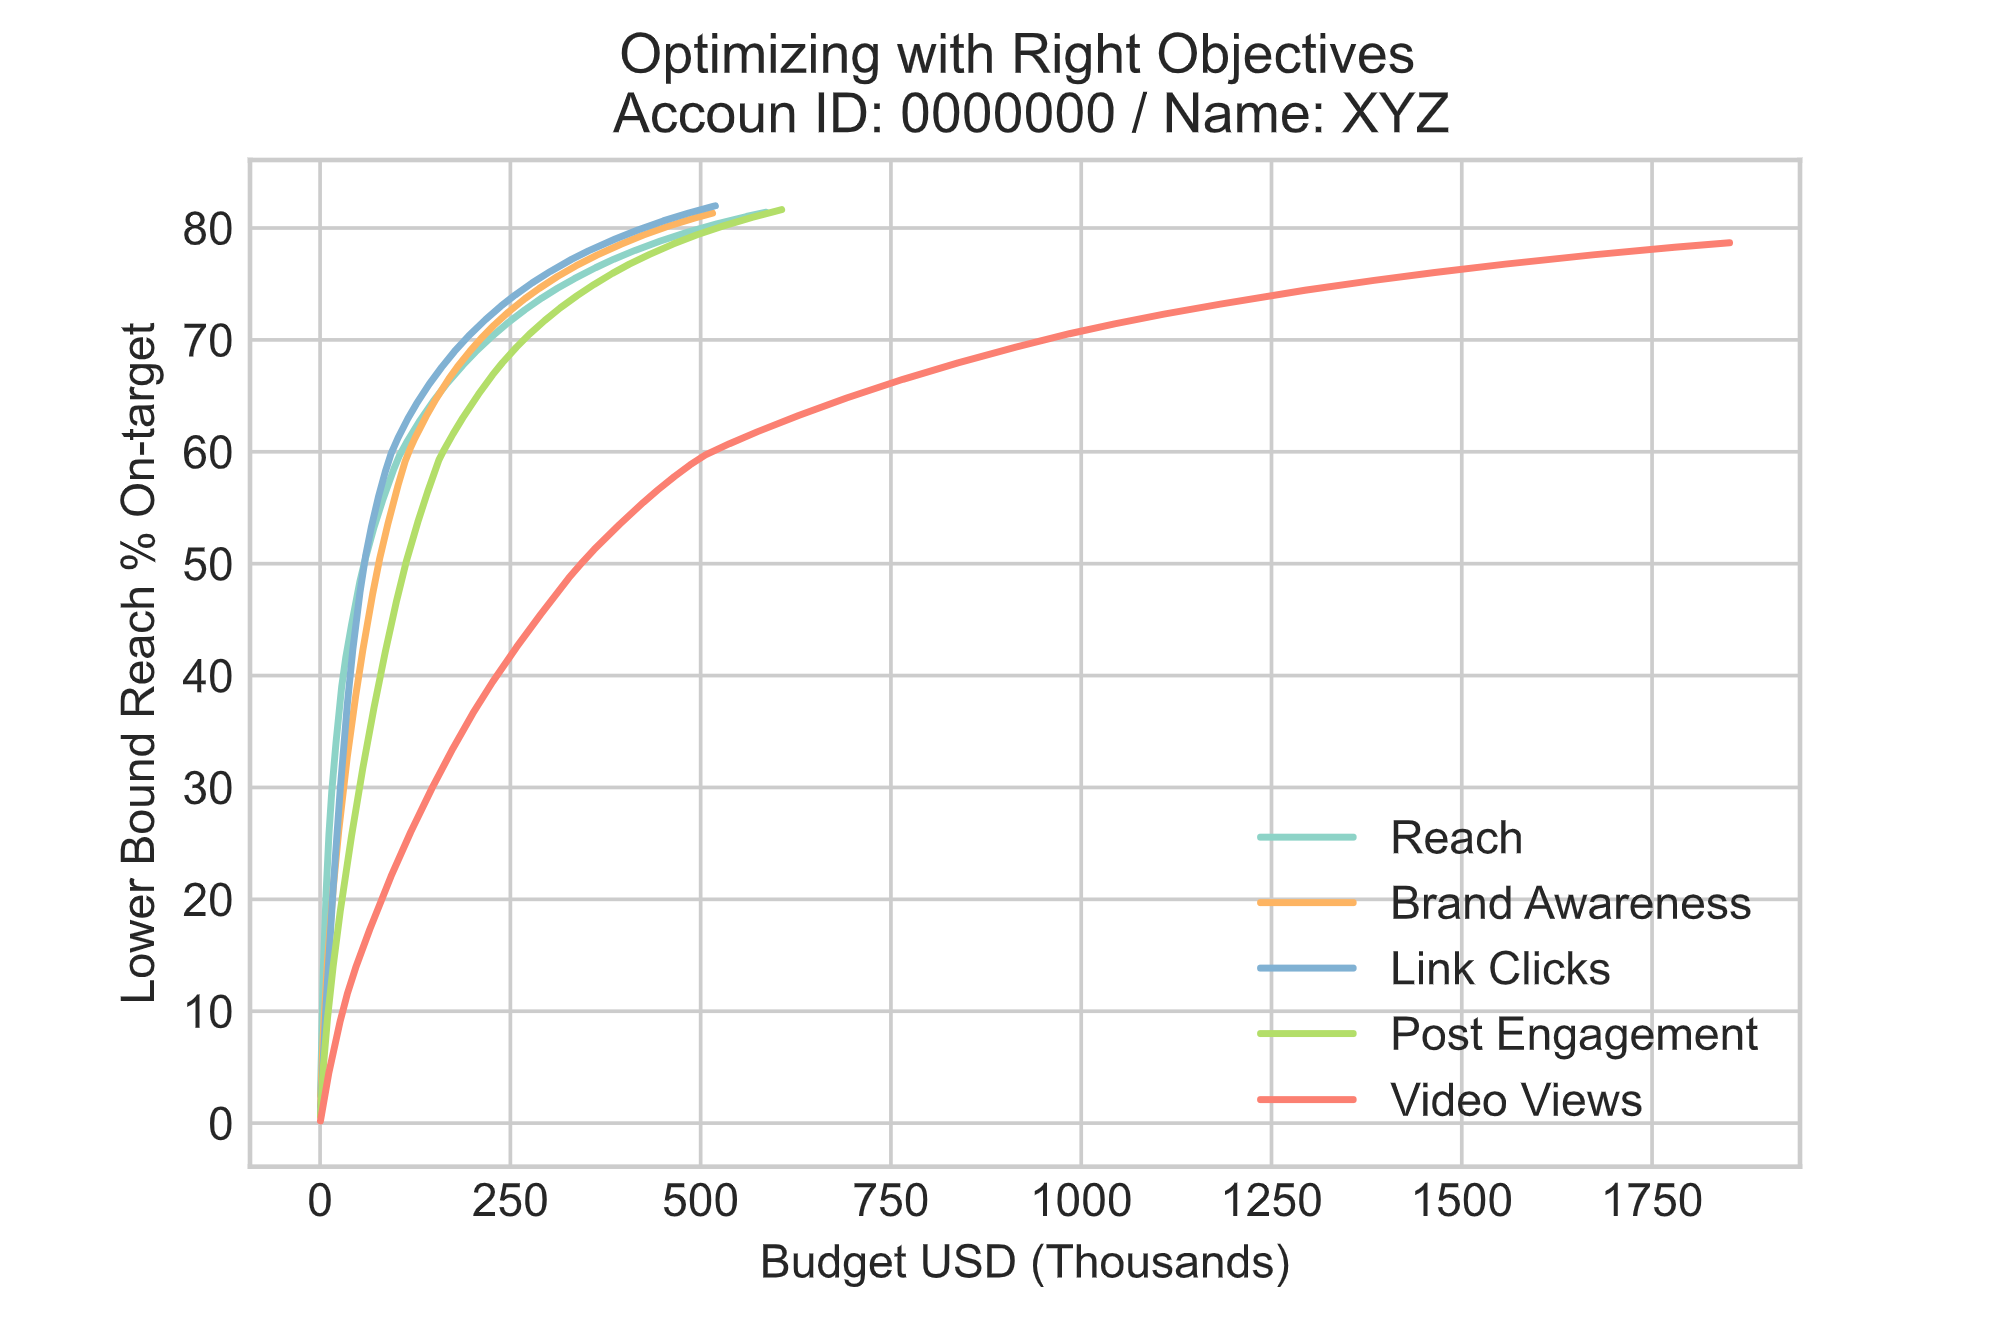
2. 01_Lower_Bound_Reach_PCT.pdf: Plot portraying a curve of Budget (x-axis) vs % predicted lower bound reach (y-axis). It's important to mention that the estimated audience size (users) is a range, so we need to compute two values for the % of lower bound reach and the % of upper bound reach.
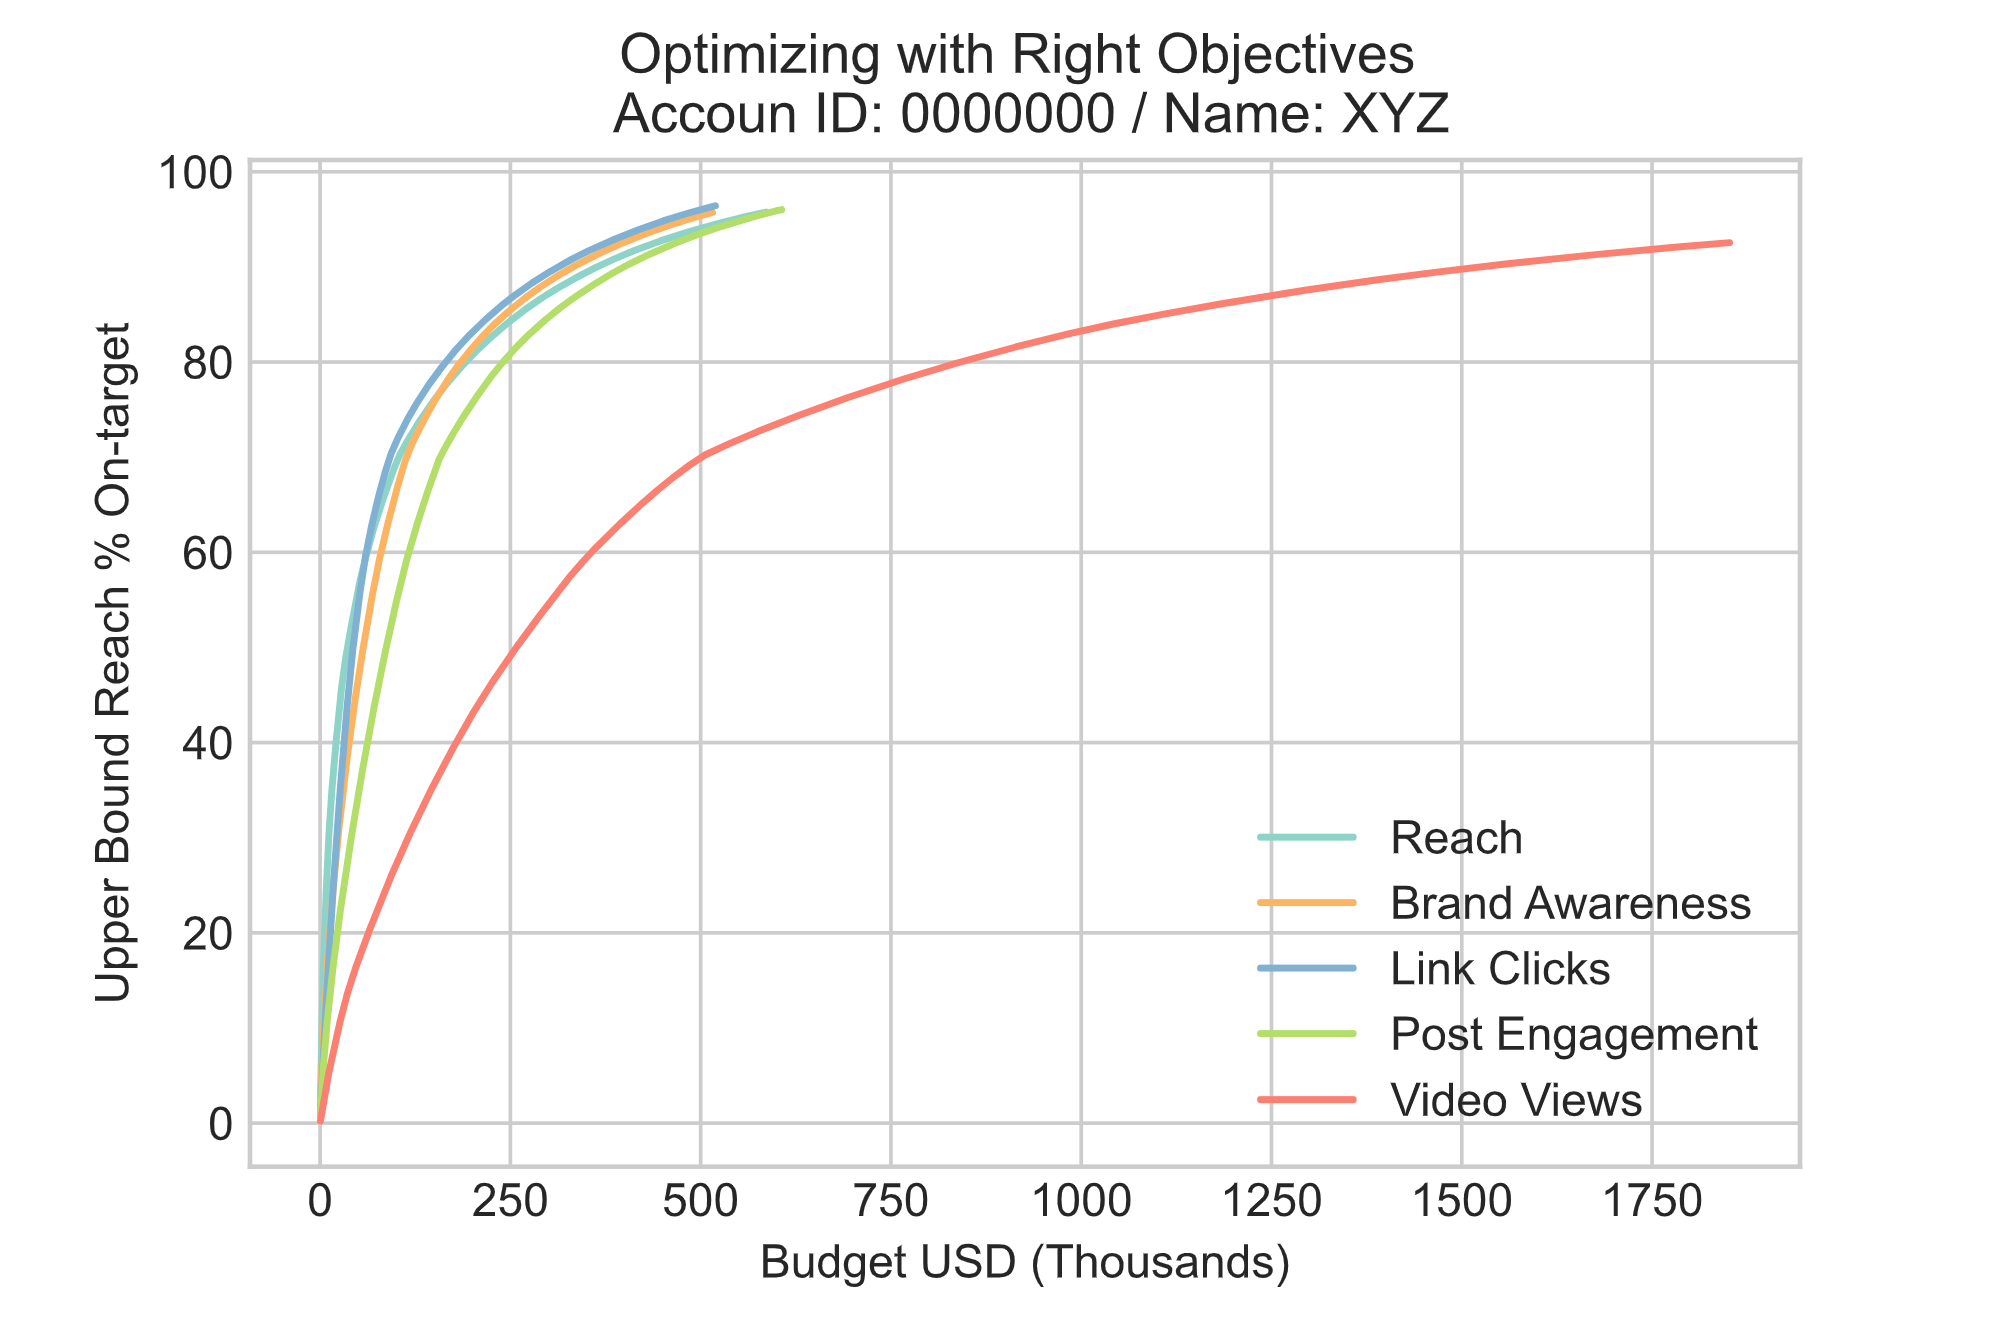
3. 01_Upper_Bound_Reach_PCT.pdf: Plot portraying a curve of Budget (x-axis) vs % predicted upper bound reach (y-axis). It's important to mention that the estimated audience size (users) is a range, so we need to compute two values for the % of lower bound reach and the % of upper bound reach.
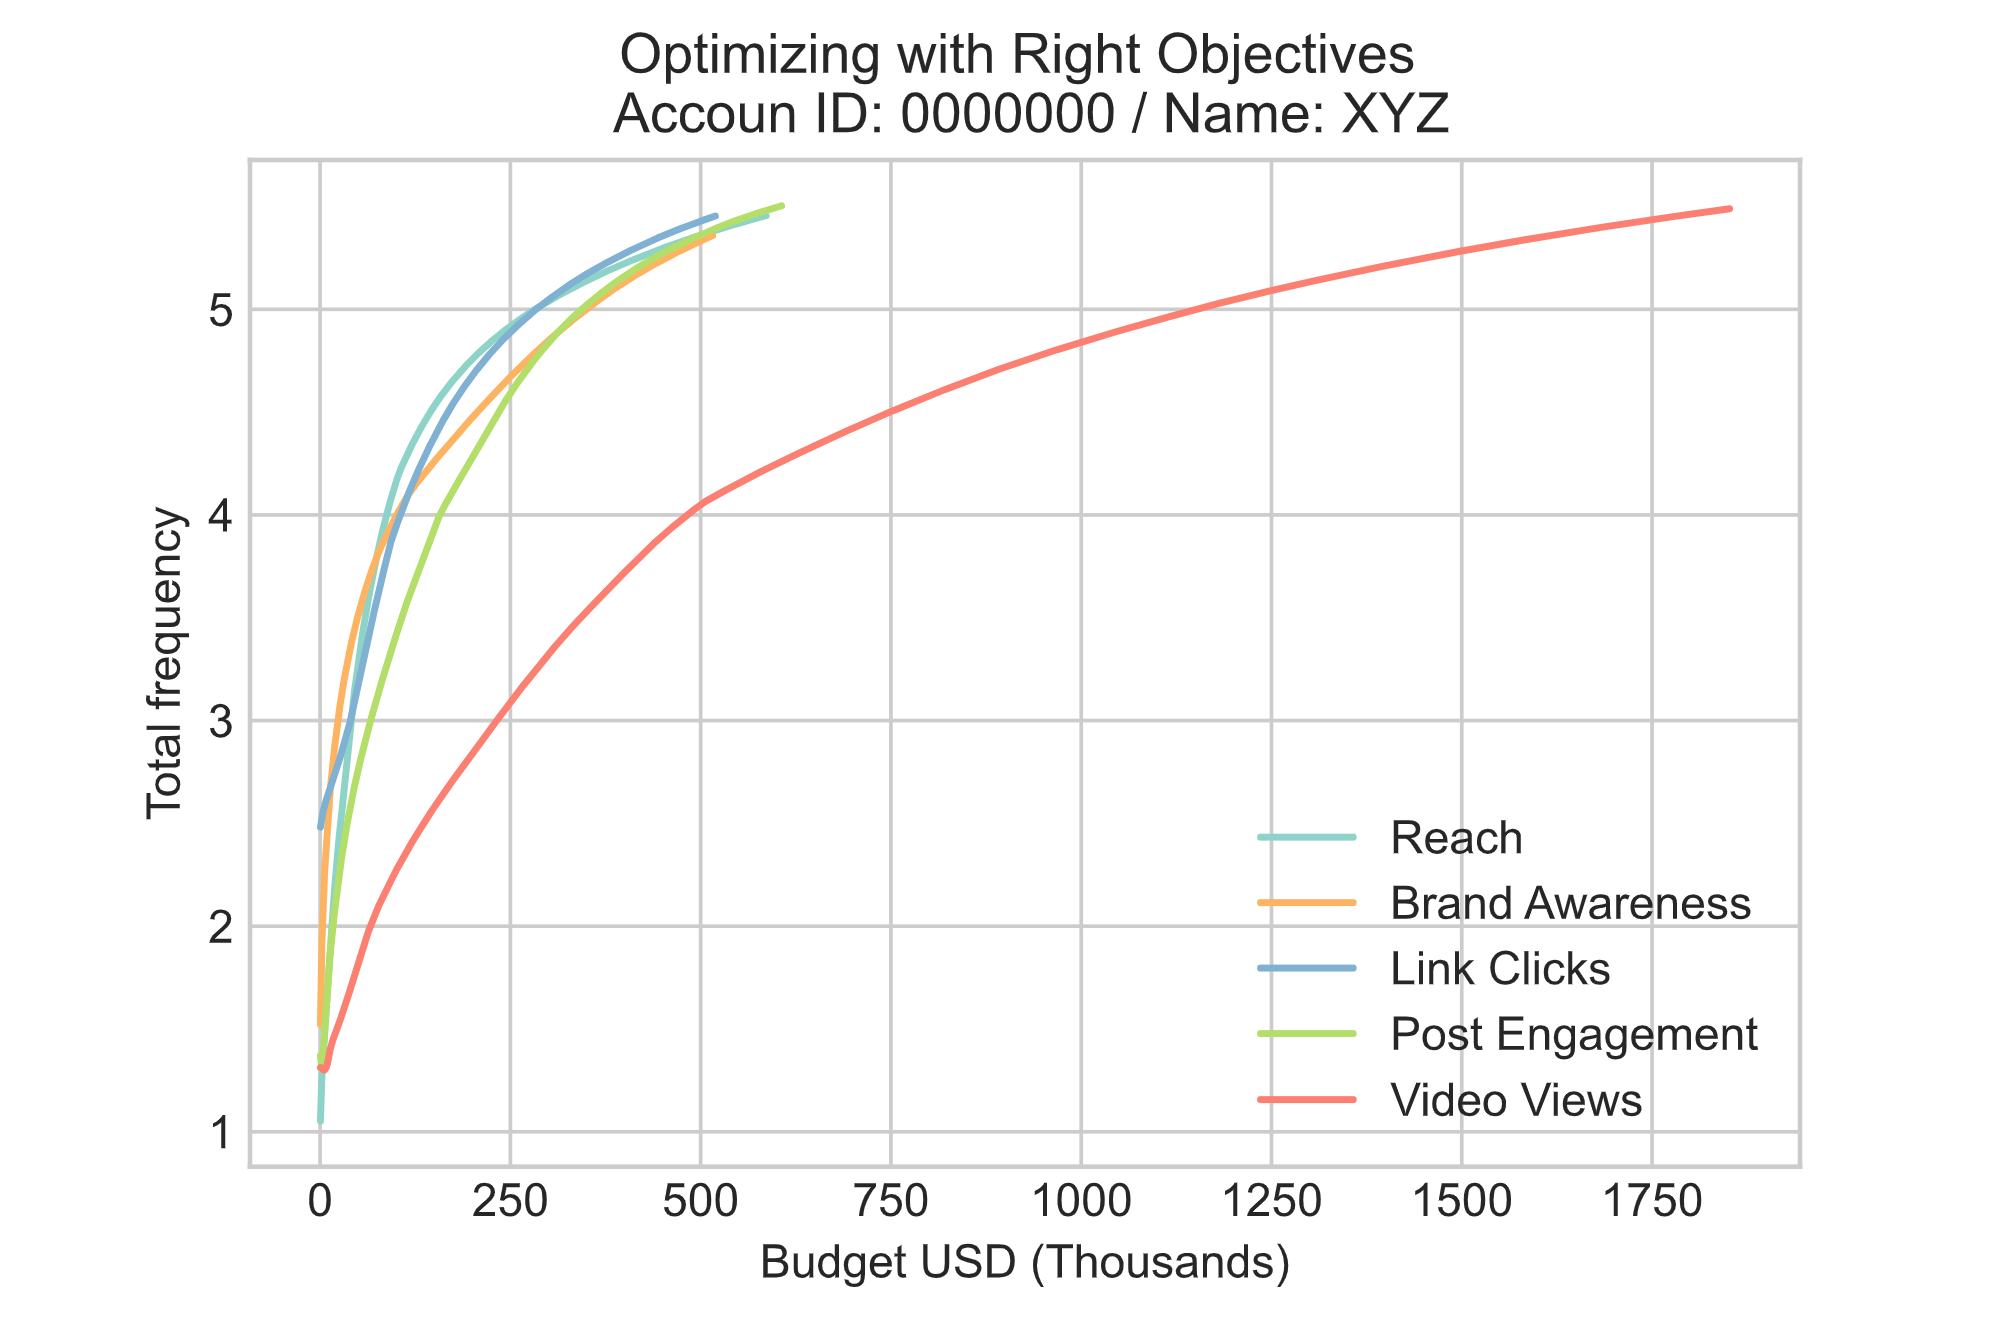
4. 01_Total_frequency.pdf: Plot portraying a curve of Budget (x-axis) vs predicted total frequency (average impressions per user at total campaign duration, y-axis)
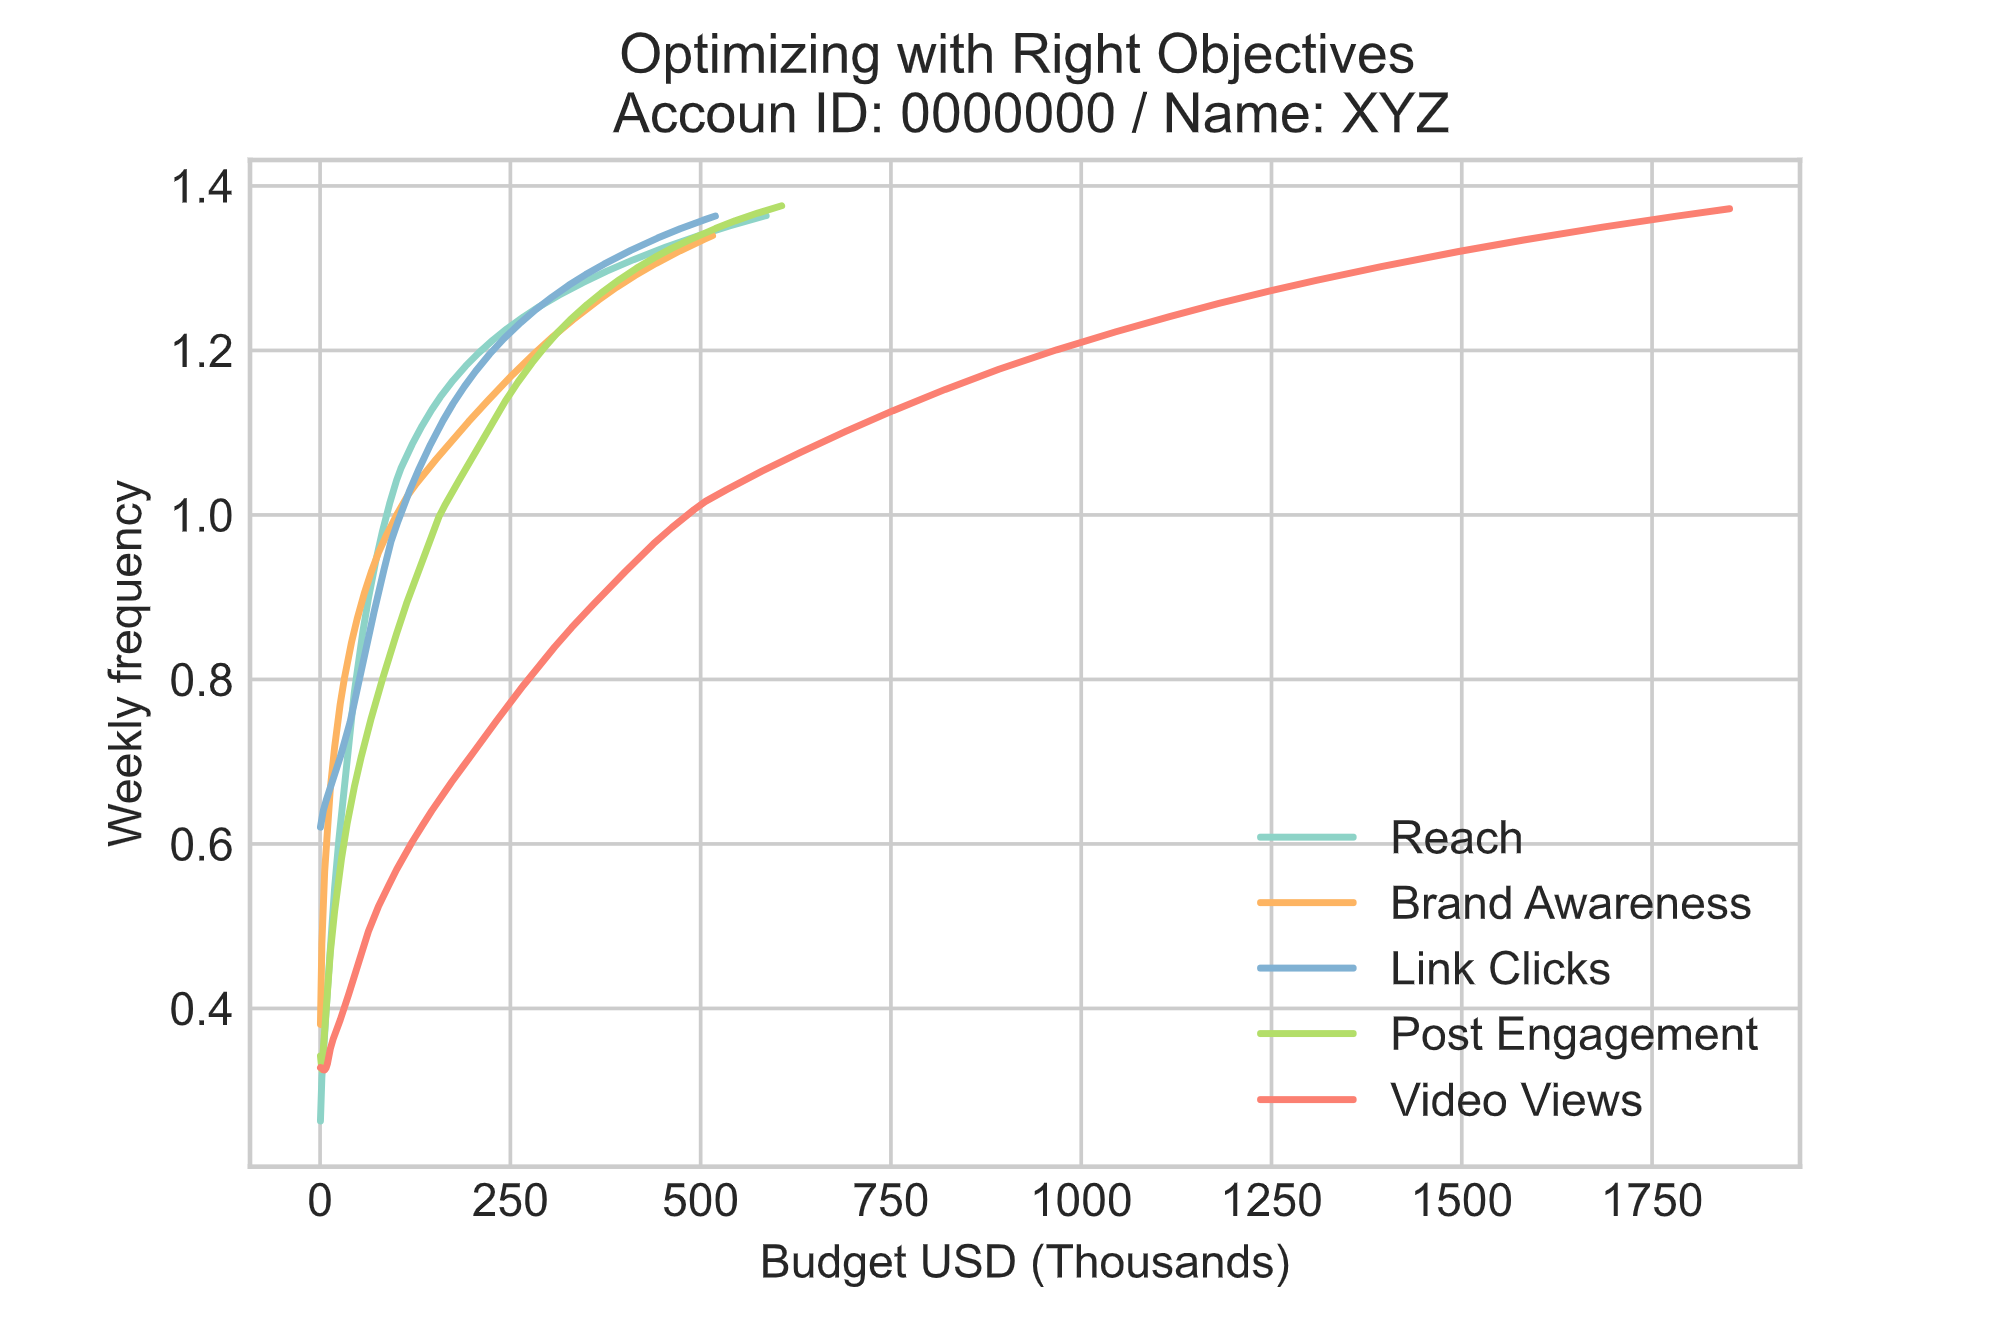
5. 01_Weekly_frequency.pdf: Plot portraying a curve of Budget (x-axis) vs predicted weekly frequency (average impressions per user per week, y-axis)
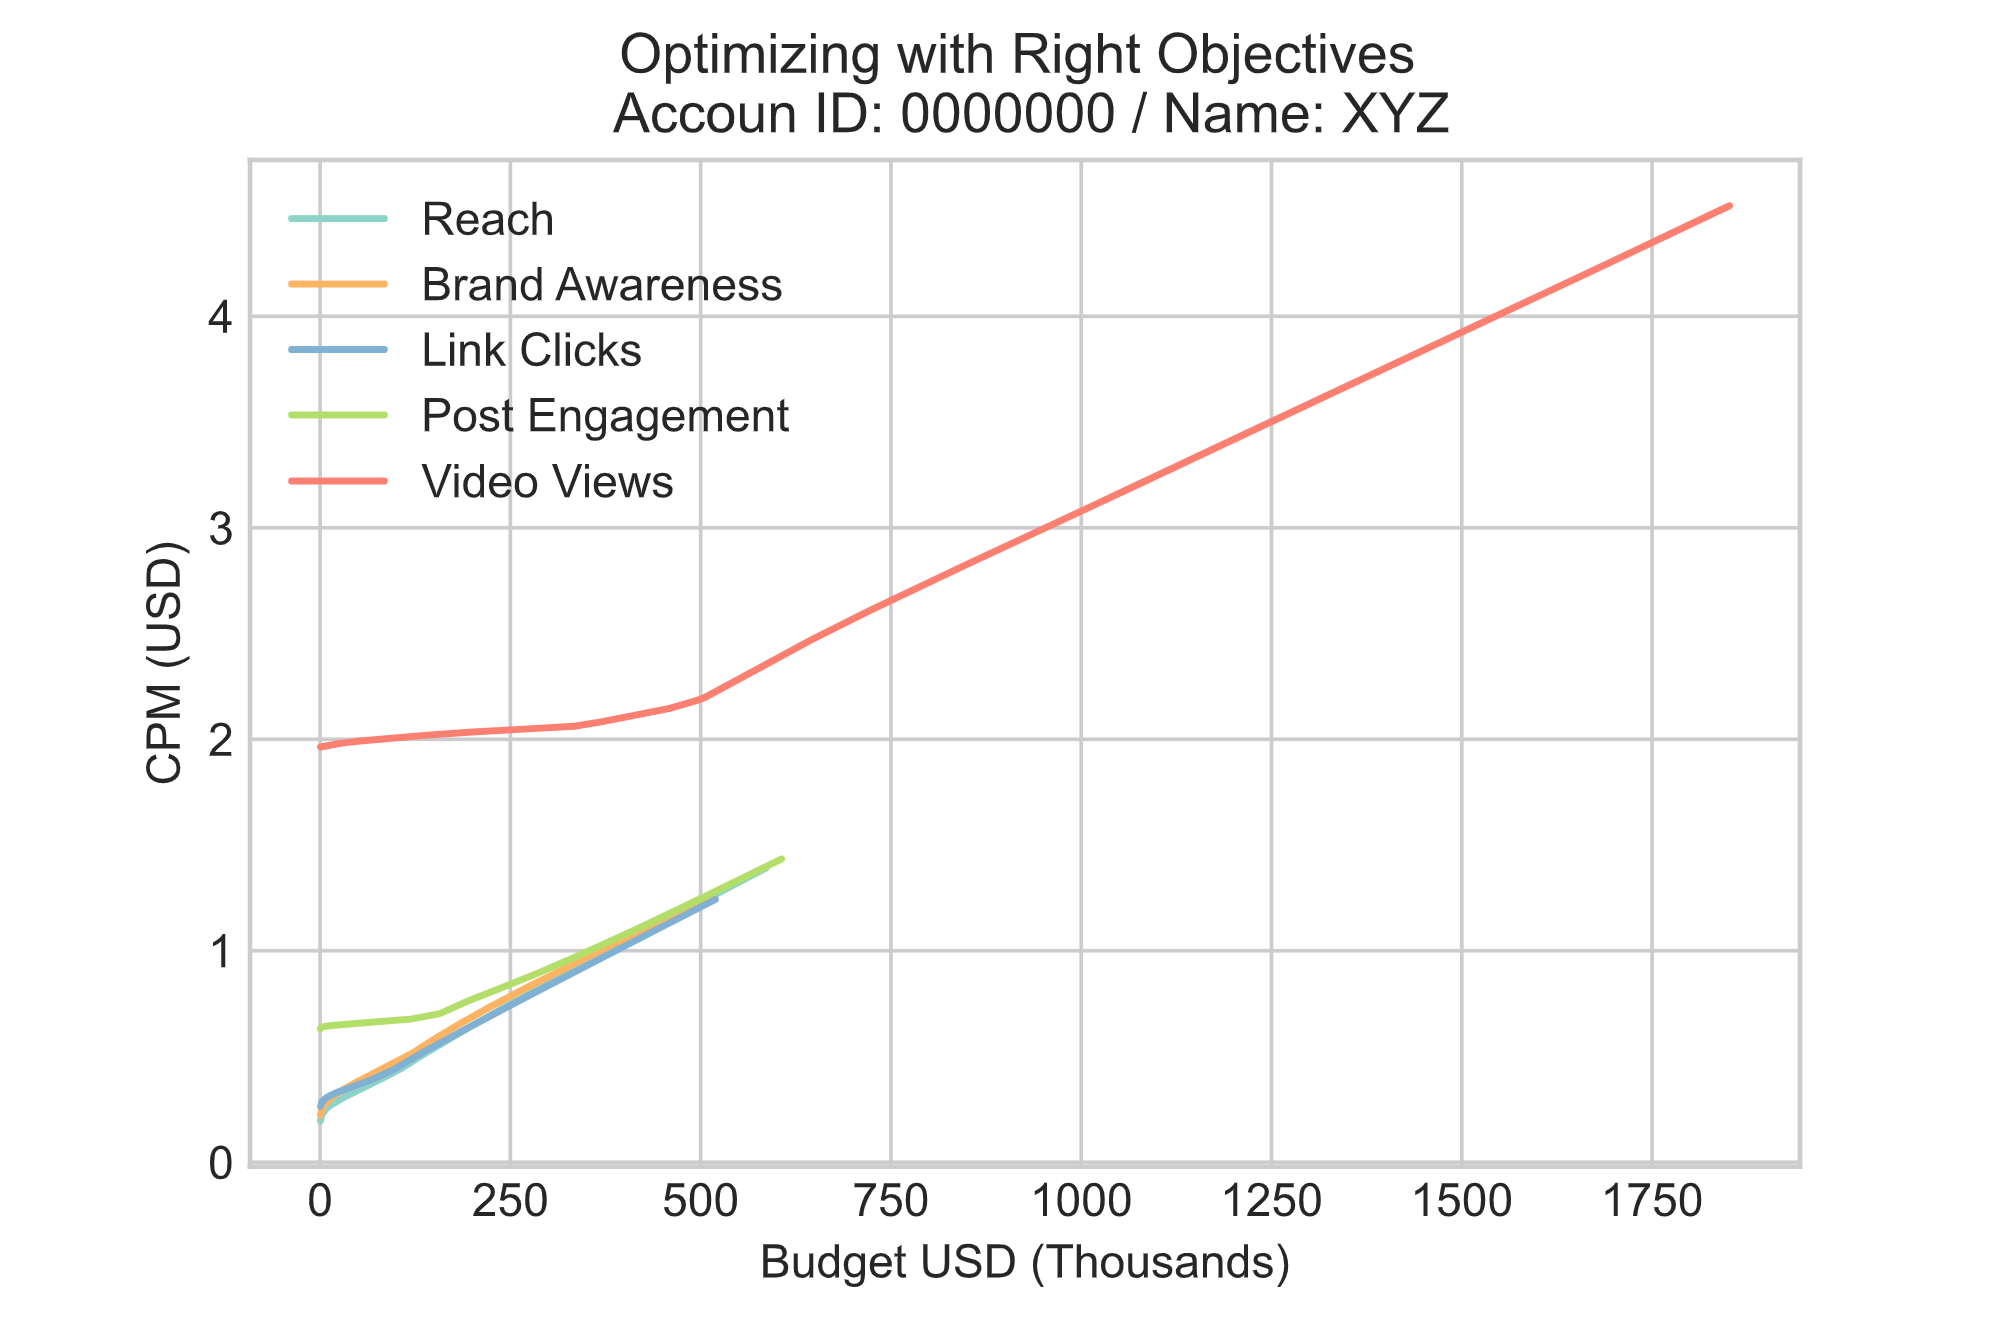
6. 01_CPM.pdf: Plot portraying a curve of Budget (x-axis) vs predicted Cost per mille (cost per 1000 impressions, y-axis)
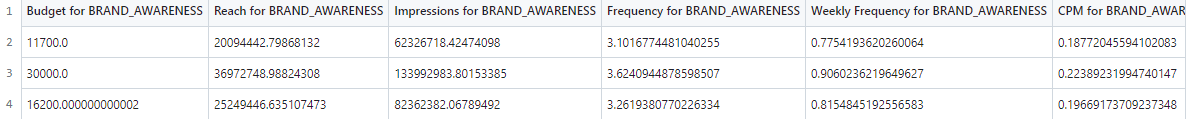
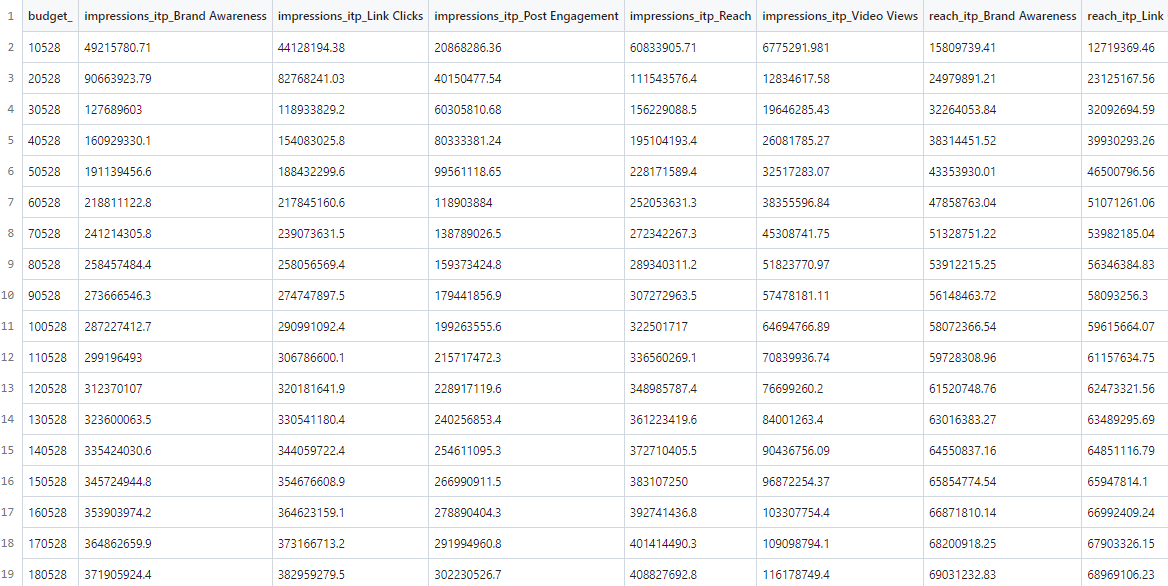
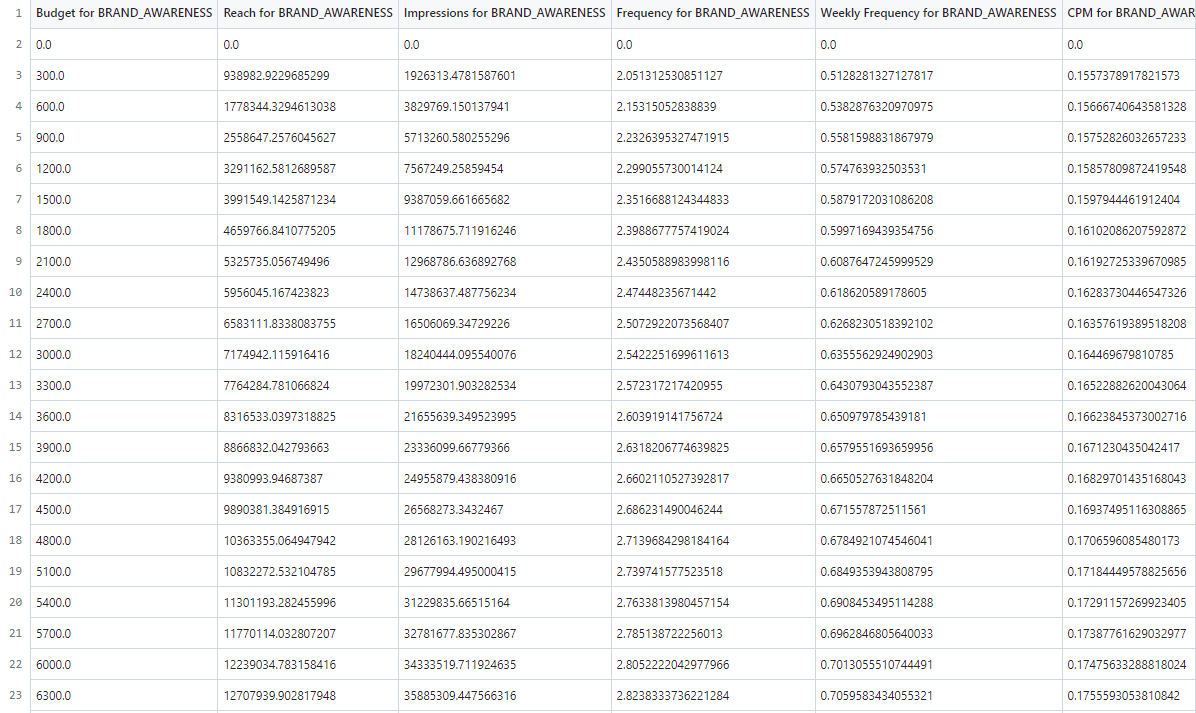
7. 01_Right_Objective.csv: Data file containing all the points needed to plot previous curves and in case you need to perform a deep dive analysis with more granularity
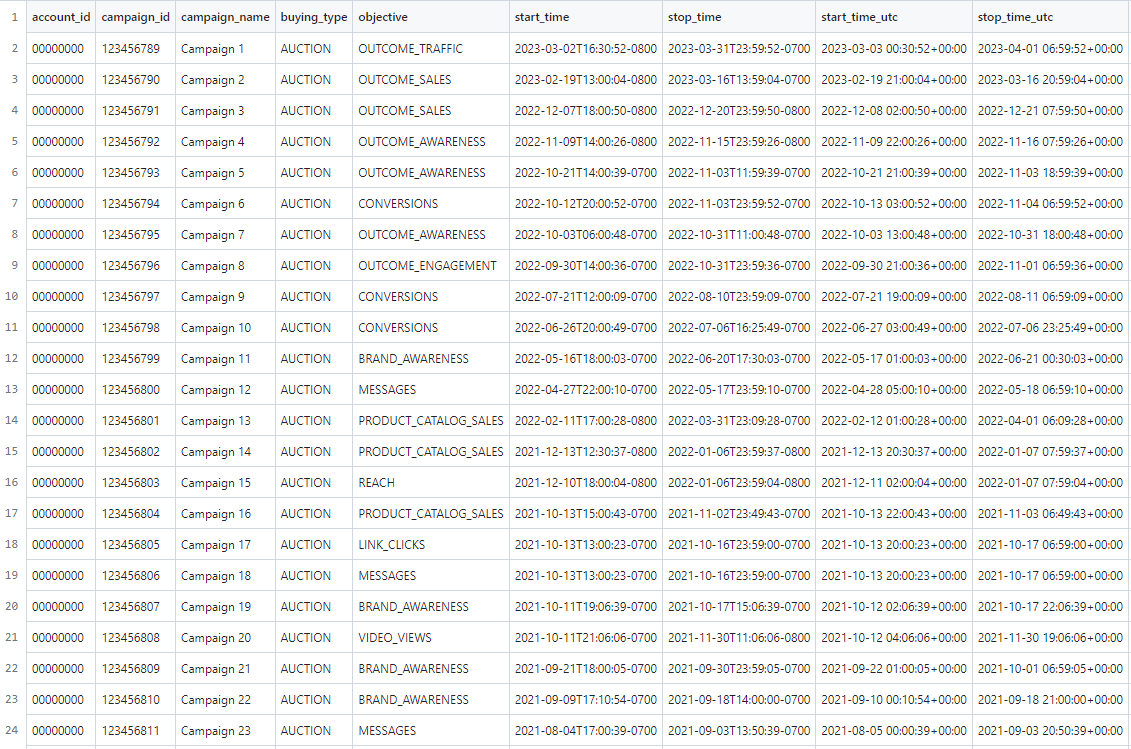
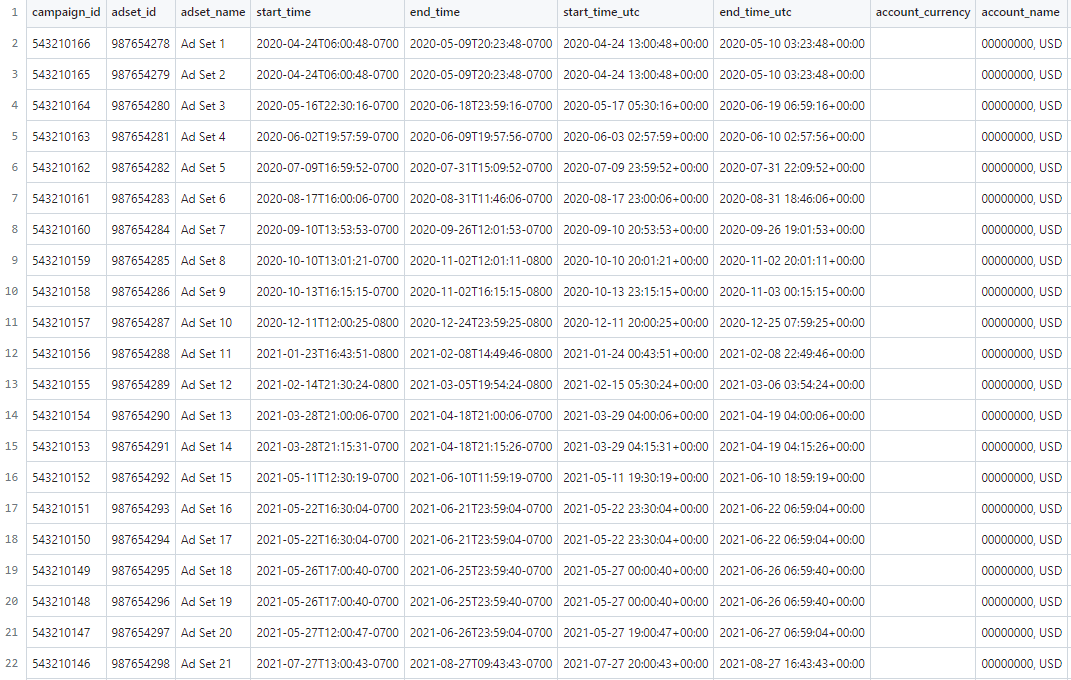
Important: OptiMate is related to the specific Ad Account you define in the input section, so all charts and files will be showing automatically currencies in the same currency your Ad Account is configured as well as the Ad Account name.
Module 3
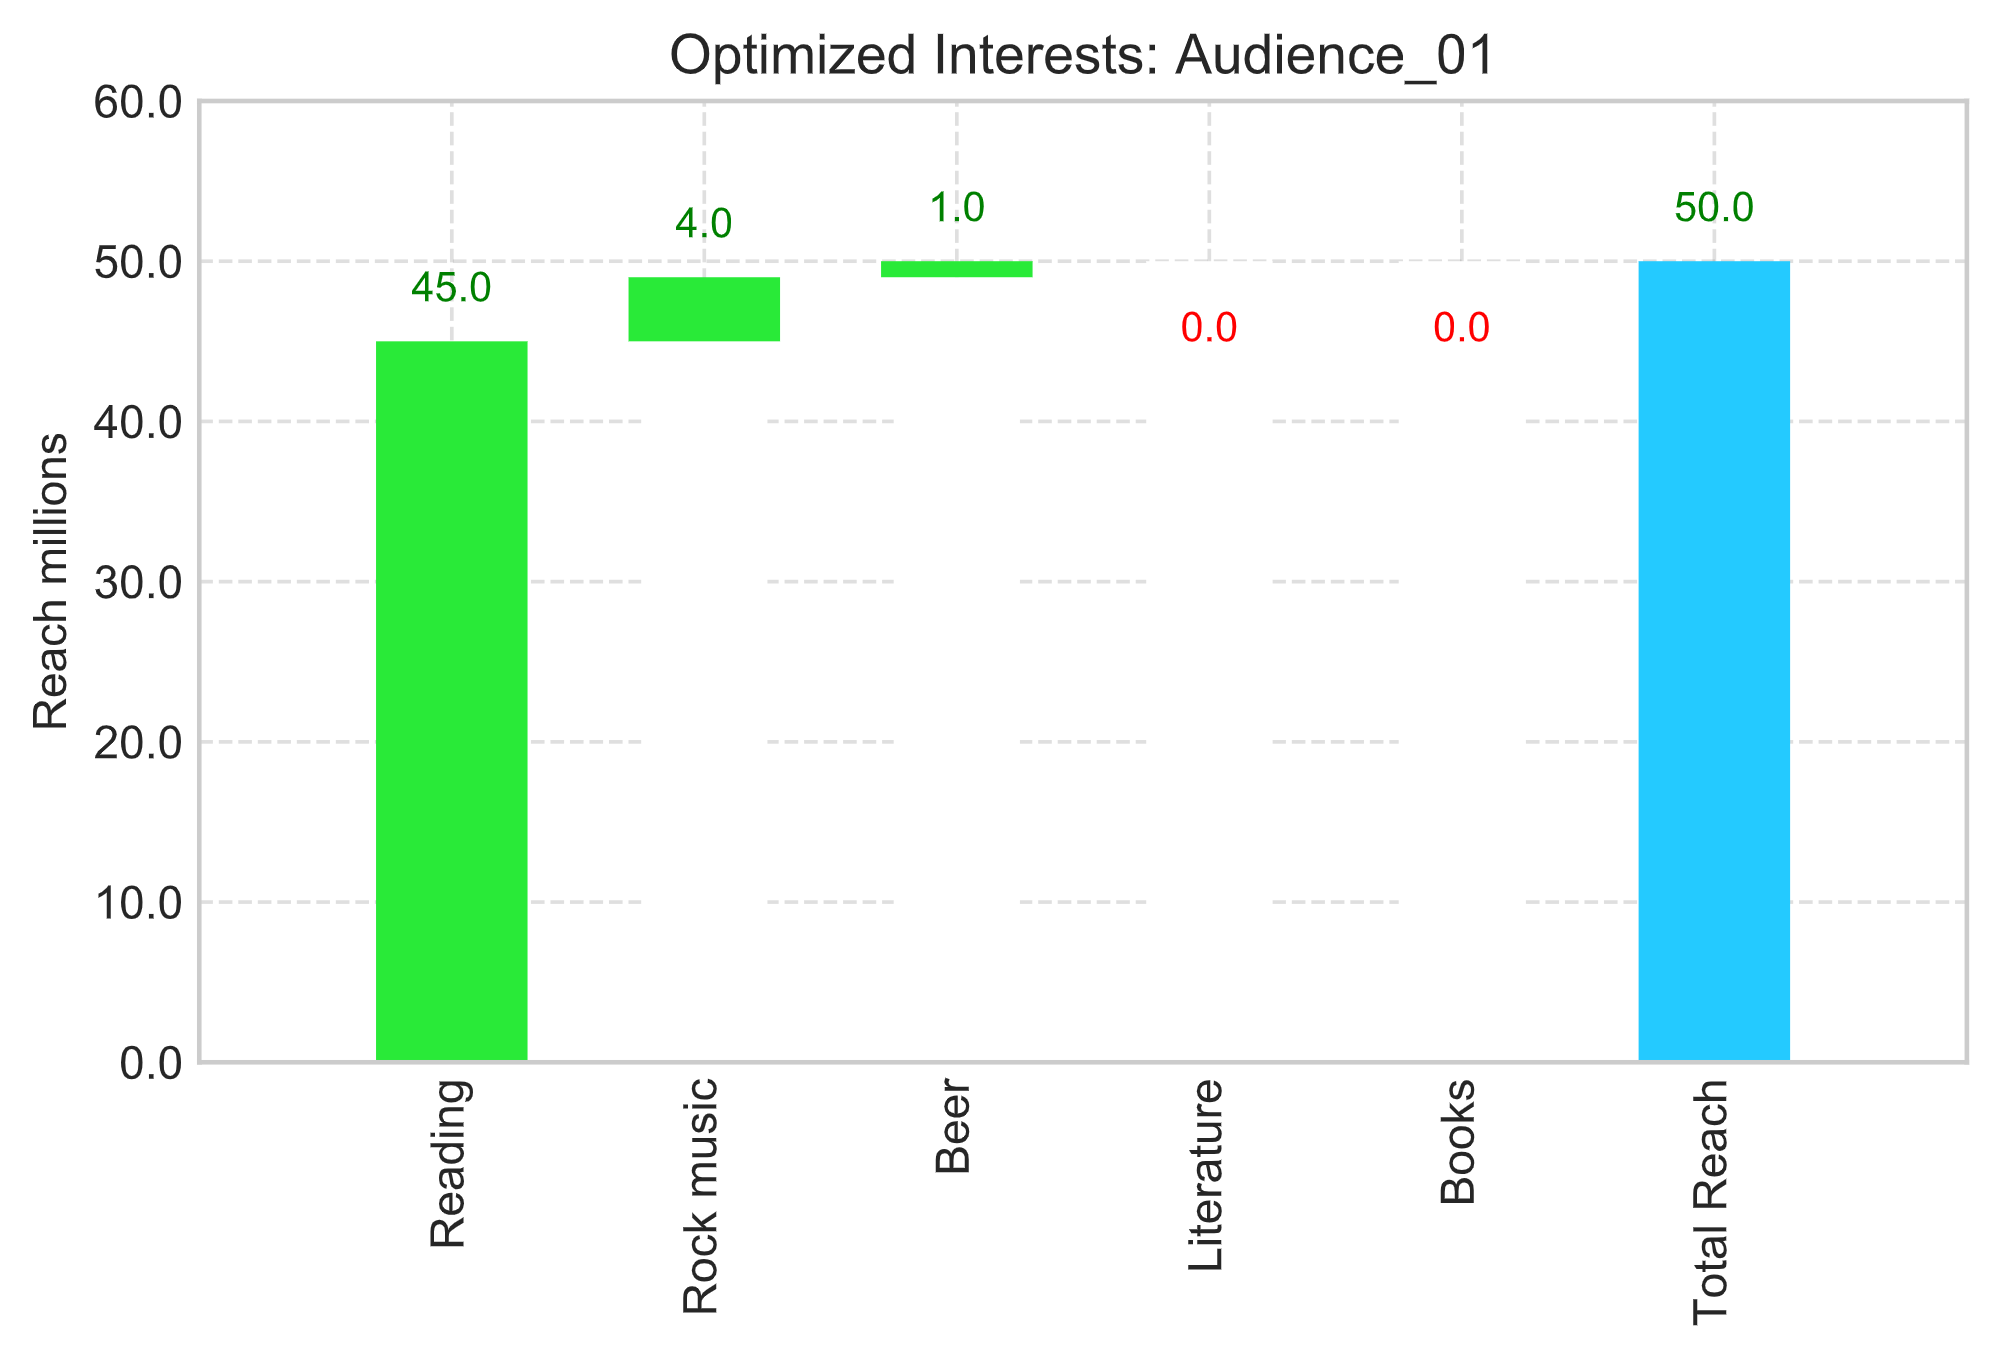
1. 03_Optimized_Interests_Audience_abs.pdf: Waterfall chart to depict reach building (million of users) when adding more interests. The main goal of this Module is to identify when we are using several interests-behaviors that are not helping to build incremental reach, so we can have a leaner auidence definition.
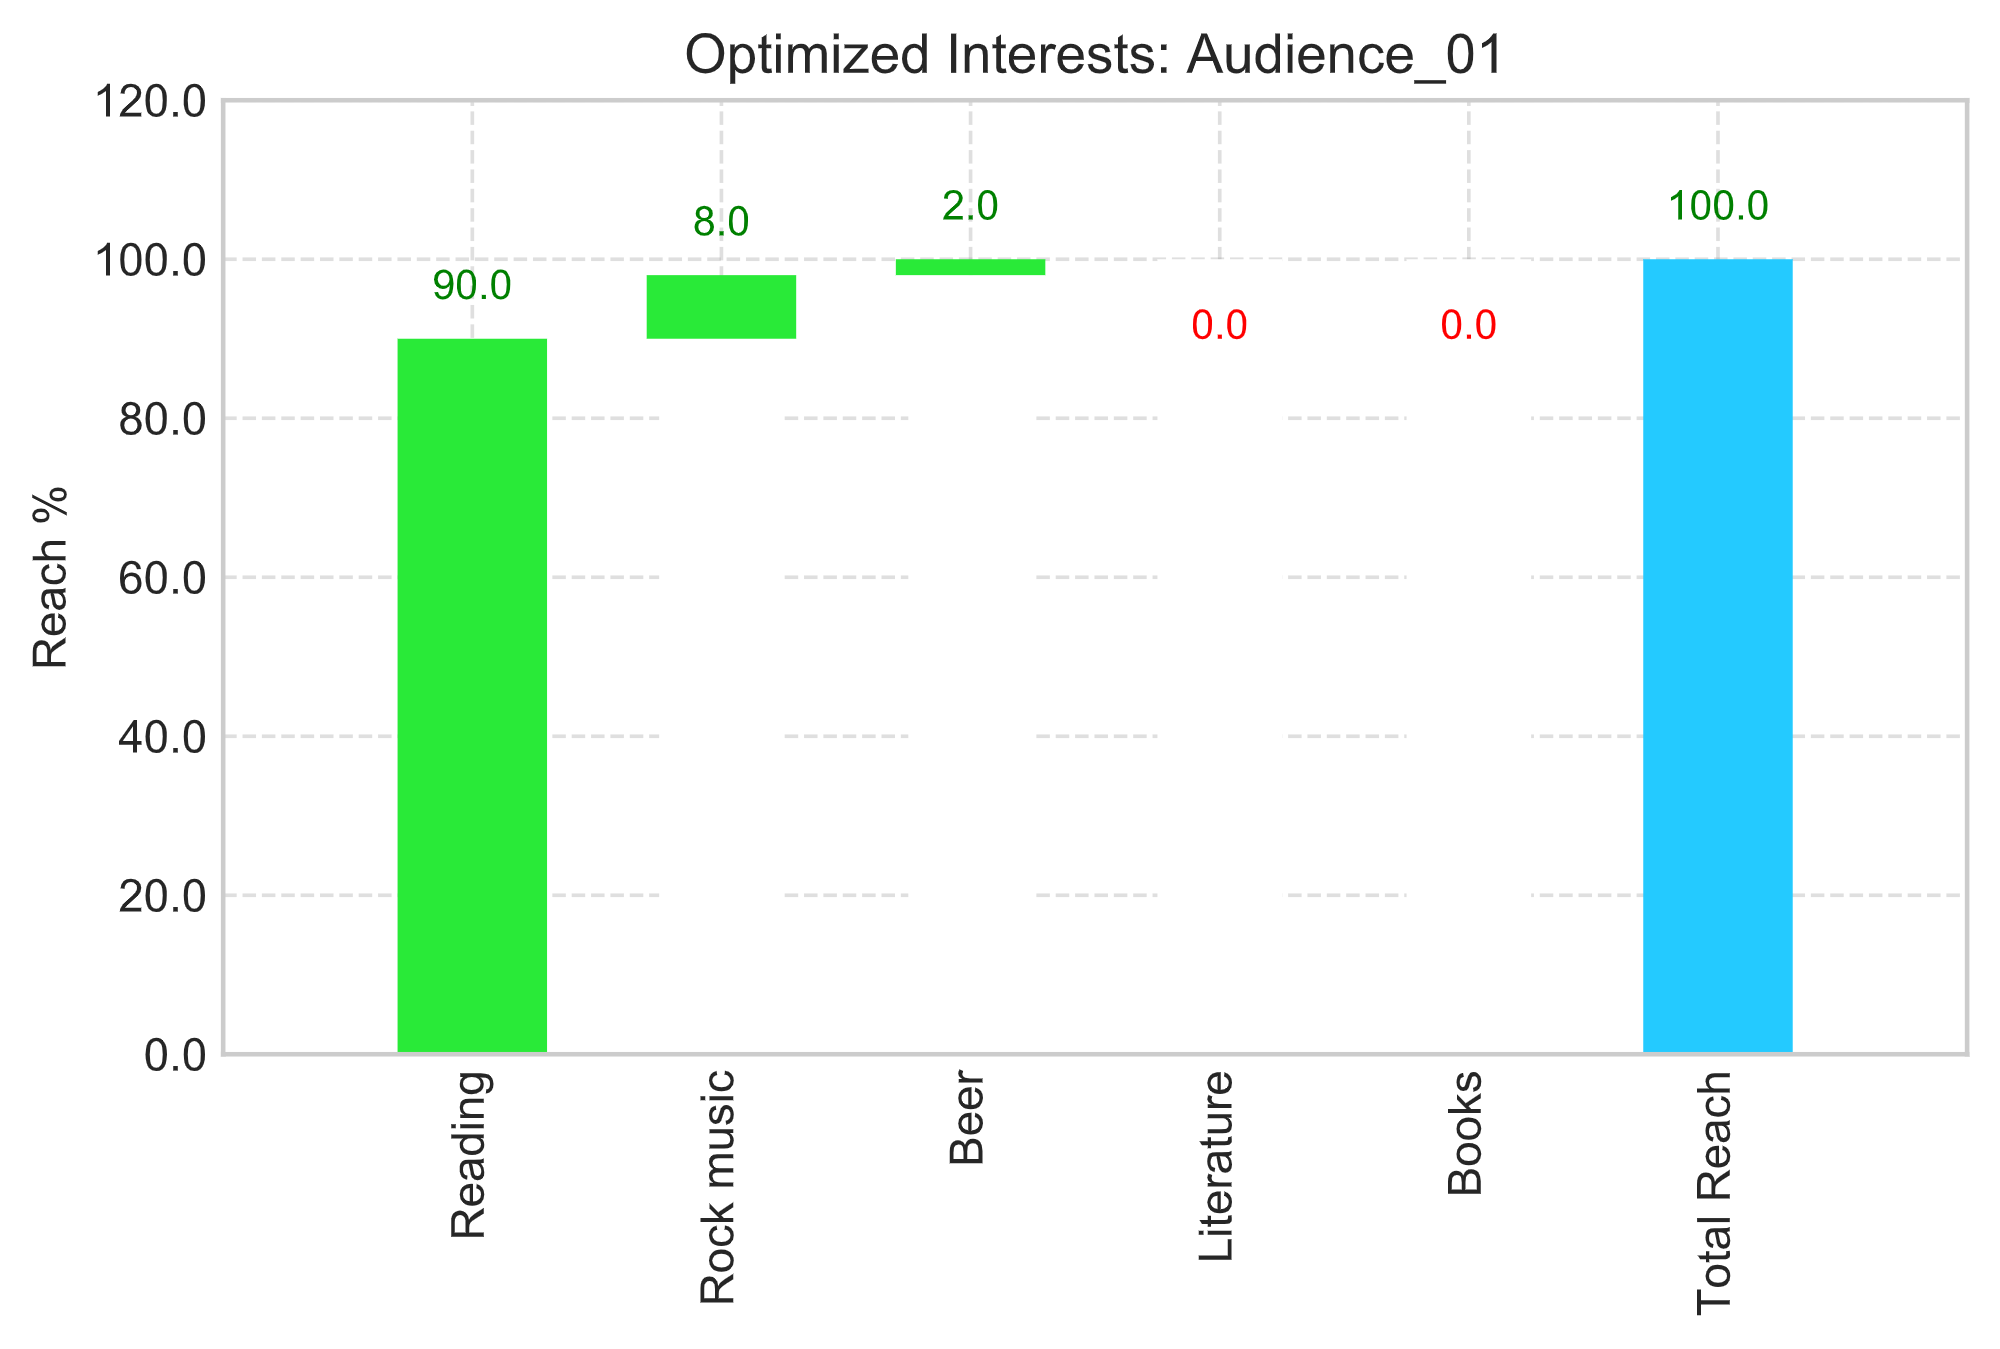
2. 03_Optimized_Interests_Audience_pct.pdf: Waterfall chart to depict reach building (% relative to total reach when using all interests) when adding more interests. The main goal of this Module is to identify when we are using several interests-behaviors that are not helping to build % of incremental reach, so we can have a leaner auidence definition.
Module 6
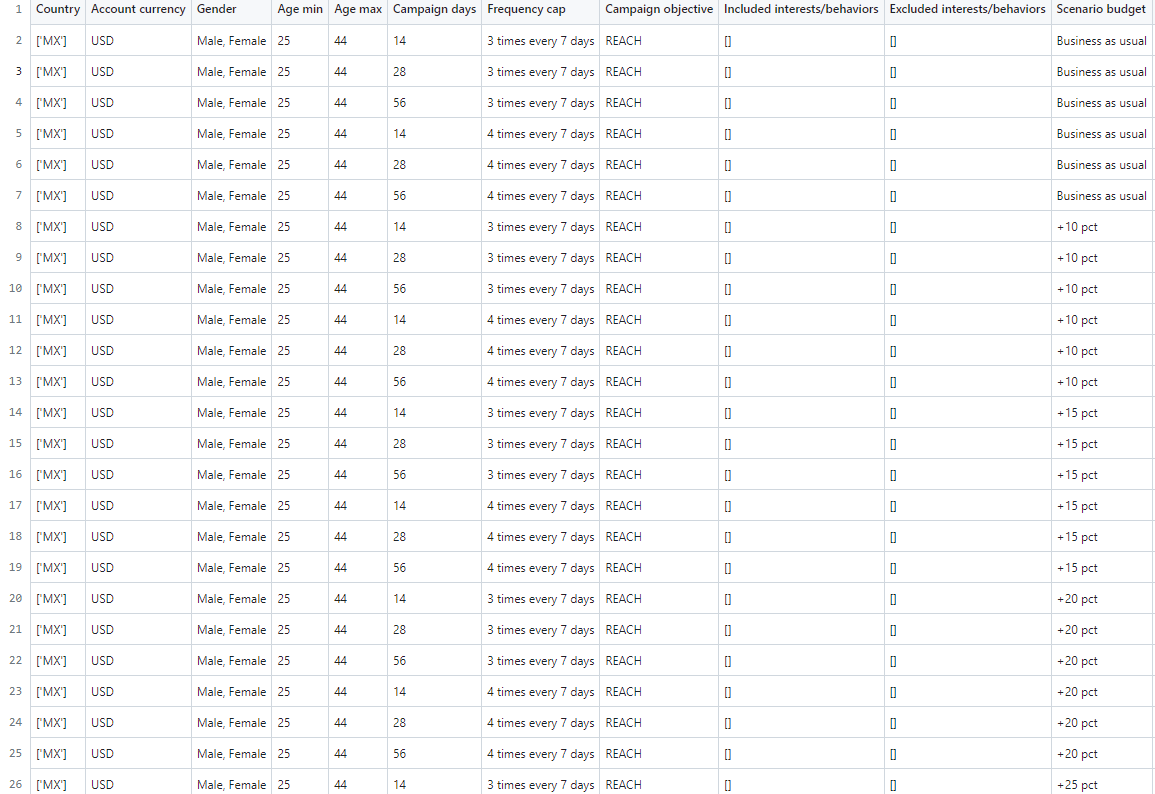
1. 06_KPI_Clean.csv: Data file containing all campaign combinations given different input parameters (objectives, campaign duration, ages, gender and frequency control caps) for different budget levels in addition to the reference budget you define.
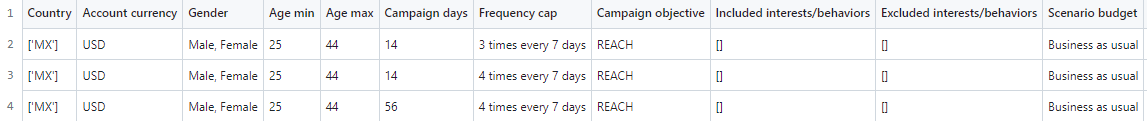
2. 06_KPI_Optimized.csv: Data file containing only three scenarios that among all combinations are the ones that maximize reach, maximize weekly frequency or minimize CPM considering the reference budget. In case none optimized scenario allows to get your desired KPIs it's recommended to take a look at the 06_KPI_Clean to validate if it's due to budget sufficiency.
Module 7
1. 07_Campaigns_Confidence_Intervals.csv: Generates a data file indicating whether each campaign ID is identified or not as an outlier under different confidence levels: 80%, 90% and 95%. In case you do not have campaigns that historically use campaign budget level (using adset budget instead), then data file will be empty
2. 07_AdSets_Confidence_Intervals.csv: Generates a data file indicating whether each AdSet ID is identified or not as an outlier under different confidence levels: 80%, 90% and 95%. In case you do not have ad sets that historically use ad set budget level (using campaign budget instead), then data file will be empty
Note: This code has to be run in two stages:
Stage 1: Fist historical run to fetch data to build confidence intervals. Time frame must be at much for the past 3 years Stage 2: Once historical data has been processed, new data can be appended to this historical data frame. You can append new data by changing dates just executing the code for the current date (not the las 3 years, for example) This stages are not included in the code, they have to be executed by each user on their own
It's importanto to mention that Module 7 generates a data file output to identify camnpaign or ad set outliers. Once outliers are identifyed it's suggested to integrate this information into a emailing delivery system to have outliers warnings in an automated scalable way.
Module 8
1. 08_Objectives_Mix.csv: Generates a data file with different objectives budget combinations: 100%-0%, 99%-1%, 98%-2%, ..., 0%-100%. In this file you can observe different trade-offs (in terms of reach, frequency and CPMs) when using a different budget mix for the selected pair of objectives.
2. 08_Objectives_Mix_optimized.csv: From all the combinations in the 08_Objectives_Mix file, identifies the percentage of each upper and mid funnel objective that mazimizes reach (not deduplicated), maximizes weekly frequency and minimizes CPM.